Sunday, August 25, 2013

Data Visualization: When To Use Which Graph

I started writing this blog when I was - bored one day - living in California. Eventually, I moved back to Washington, DC and stopped updating the blog. Now that I have moved out of DC (slightly south to Norfolk, Virginia), I feel like picking it up again. One gripe that I have is that my previous posts were written on my trusty Acer laptop running on Windows XP. I had no problem with it. My new Lenovo Yoga 13 laptop running on Windows 8, which cost twice as much, is turning out to be quite the piece of crap. Anyway, today's topic is data visualization - which is depicting data in some schematic or graphical form so that the main points of the analyses can be easily and succinctly communicated to the user. We have heard that 'a picture is worth a thousand words'. More true when it involves numbers.

When to use what graph depends on a number of factors. Please note that these are all suggestions. Only you can decide what graph best represents your data.

Graphs based on data types

Use line graphs to show continuous data. The graph below shows temperatures for New York City over a period of six days.

Use bar graphs to show categorical or discreet data.In the example below, the number of hours spent watching television has been grouped into distinct categories.

Use both line and bar graphs to show intersection of continuous and categorical data.In the example below, the number of TB cases per year (discreet data) in California are shown as bar graph, while the infection rate (continuous data) is shown as a line graph. The graph also makes clever use of blue for the right axis to align it with the line graph. Such clever uses of color and technique enables good data visualization.


Graphs based on Number of Items

If your data can be grouped to few categories, use vertical bar graphs to show those categories. In the example below, the data has been grouped to only four music type categories: hip hop, classical, rock and Jazz.

On the other hand, if your data can be grouped into many categories, use horizontal bar graphs instead. The example below shows the population for 10 countries.


Graphs showing proportion

Use pie charts to show share of total (i.e., all the parts add up to 100 percent). Use this chart when the actual size or number is not important, but you are trying to convey that some parts or portions are significantly greater than others.

If you want to show proportion in addition to another variable (for example, year), use stacked bar graphs.

On the other hand, if you want to show proportion in addition to two or more variables, use a heat map. The cell size represents proportion in relation to total, while the impact of the other variables are captured in the cell color.In the example below, cell color is based on retail sales.


Graphs based on time

If you're showing data for only a few periods involving one or several items, use bar charts. The chart below shows one item (i.e., funding) for five years.

If you're showing data for a few periods but involving many items, it's best to use line graphs. The graph below shows wage increases for five countries for a period of 10 years.

Use a line graph if the data involves few items but a longer period of time. The graph below shows the U.S. annual GDP and national debt for 220 years.

Use a circular area chart to show cyclical periodic data. The graph below succinctly shows and compares the annual average temperature  for three cities: Bermuda, Sydney and Memphis.


Graphs showing relations between variables

Use a scatter plot chart to show the relationship between two variables.

Use a bubble chart to show the relationship between three variables.


Graphs Based on Location

Use a map to show data if it involves area or a location. The map below shows what carbonated beverages are called in different parts of the country.

Data Visualization Cheat Sheet

Here's a map which summarizes all the information above into one neat page that can act as a cheat sheet:

Finally, here's a few pointers when creating data visualizations.
  • Easily to understand. The purpose of the visualization should be apparent to the viewer.
  • Use only elements that are needed to provide a point, not more or less. Do not crowd the graph.
  • Be aware of aesthetics  (i.e.,  avoid loud color schemes if possible).
  • Make sure that the graph accurately represents the underlying data. 
  • Properly title the graph and assign labels to the graph elements
  • Consider using a bright color to show a break or unusual data activity, while pale colors for the rest of the graph elements.
  • Be cognizant of the space that can be allocated to the graph.


Saturday, November 6, 2010

A Snapshot Of Traffic To My Site

Google blogger has a neat aspect, that not only provides feedback on the number of site visits, but shows the operating system, type of browser, and originating countries for those visits. I find the world map to be a nifty feature. Without further ado, here are some figures on site traffic to my blog.

Last month (October 7, 2010 to November 5, 2010), there were 808 visits to my blog (Not a lot I know, but I wasn't sure whether anyone was even reading my blog). The visits came from a total of 10 countries: USA, Canada, France, Netherlands, Poland, Israel, India, Pakistan, China and South Korea. Not surprisingly, the majority of hits came from the U.S.(97.5%). Encompassing 98% of all traffic, Microsoft Windows was the overwhelming operating system (OS) used to access my blog. Apple's Macintosh OS was in second place involving less than 1% of traffic. There was one instance of UNIX accessing my blog (probably a crawler). Five types of browsers were used to access my blog: Firefox (61%), Internet Explorer (36%), Safari (1%), Chrome (1%) and Opera (1%).

For the week (October 29, 2010 to November 5, 2010), there were 119 visits from six countries: USA, France, Poland, Russia, China and South Korea. Again, the majority of hits came from the U.S. (90%). With the exception of one user, everyone used MS Windows OS to access my blog. The lone user was using Apple's Macintosh OS. Four types of browsers were used to access my blog: Firefox (75%), Internet Explorer (22%), Opera (1%) and Safari (1%).

Here are the most accessed posts for the week (October 29, 2010 to November 5, 2010). Not surprisingly, Kick Starting Your Analytics Strategy was the most popular post with 17 hits. That's probably one of my better posts, and the topic that prompted me to start writing this blog.

I will finish with this useless trivia - the total surface area for the countries mentioned in this post is approximately 20 million square miles, which comprises 35 percent of the earth's land mass.

Saturday, September 25, 2010

Crappy Customer Service, Or Totally Awesome?

Few things in life are as fun as putting together a mortgage application on a Saturday morning. But there I was, working furiously to complete my application, lest the rates jump up before I could send my package to the broker (Yep, I get spooked very easily). One requirement was to provide two months of bank statements. Being the tech savvy person, I locked myself out of the Citibank website (be cautious when typing your password or other information. Three wrong attempts, and your day is pretty much ruined). After the customary call to the help center where a heavily accented guy named ‘Jay’ (Don’t snicker, guys. It could be short for Jaysuria) informed me that I needed a new PIN and my best hope was to go to a local Citibank branch. He could request a new PIN, but that would take five business days (and leave me completely hosed).


I rushed to my local Citibank branch with two forms of identification, and approached the customer rep. It turned out that my PIN was still valid, but the website had locked me out. The customer rep, a really nice elderly guy, told me I could use his computer to unlock my account and get a new password. He also called the help center for me. So I ended up sitting on his chair, talking on his phone, working on his computer, behind the customer rep desk.

As I was speaking on the phone and trying to reset my password on the computer, a person approached the customer rep desk. The Citibank customer rep took him aside to discuss his problem. As luck would have it, a snobbish couple entered the bank a few minutes later, and walked straight towards me. There I was – unshaven, wearing jeans, a wrinkled T-shirt with the words ‘INTO GETTING DIRTY?’, talking on the phone, completely ignoring them. As I made eye contact, I could tell both of them were pretty pi$$ed. The woman shot me an angry look, like she was going to burn me to ashes right there. The stare lasted only for a few seconds, the customer rep came running and took them away.


I am guessing the couple and I walked out of the bank with completely opposite views on service. For a few minutes, I felt like an actual Citibank employee. Oh well, something to talk about at the office on Monday morning.

Friday, June 25, 2010

Tracking Incidents And Functional Changes In A System

Over the years, I have worked for quite a few organizations. In any organization, tracking incidents and functional changes in a system is a very challenging task. Unfortunately, most places don't do a good job in tracking these changes. Nevertheless, I found this Excel template to be a very cheap and effective tool for tracking incidents and functional changes in a system.

The tracking document has three main sections. The summary page, the open incidents page(s), and the closed incidents page. If needed, another section can be added for action items. These sections are discussed in detail below:

The Summary Page
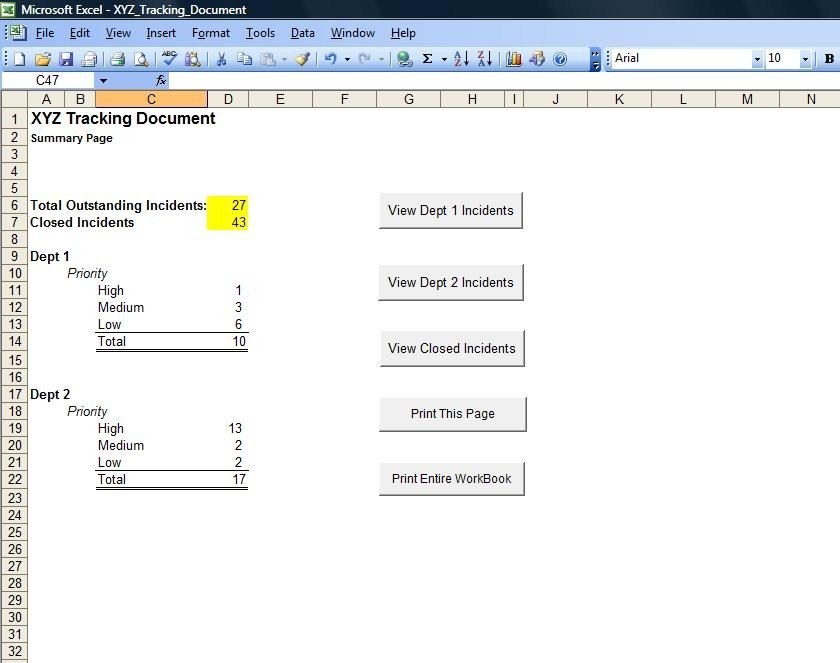
The Summary Page has a simple layout that show the number of incidents that are open, and the number of incidents that have been closed. There are additional drill down sections that shows the open incidents for each department (i.e., dept 1, dept 2, etc.). The open incidents for each department is categorized by priority (i.e., High, Medium, Low). The priority count is calculated by a macro that inputs the value directly from the 'severity level' column from a particular department's open incidents page. the closed counts are directly input from the closed incidents page, using an Excel VBA macro.

The page also contains several buttons for ease of use. In the example below, the first two buttons opens the 'Open Incidents' page for their respective departments. The third button opens the 'Closed Incidents' page. The fourth button prints summary page. The fifth button prints out the the entire tracking work book in a predetermined print layout.


Here is the Excel VBA macro code for calculating incidents in the summary page.

Here is the Excel VBA macro code for the buttons.

Assigning the Excel VBA macro code to the buttons.


The Open Incidents Page
The Open incidents page contain the functional changes that are yet to be completed. Ideally, there should be one Open Incidents page per department.


The incidents are color coded to depict whether the changes are being made on time, or the deadlines are slipping. The color of the row is assigned by a VBA macro that calculates the difference between the expected date (i.e., ETA) and the current date. If the difference between the ETA and current date is seven days or less, the incident row is given a yellow color. If the ETA has been missed,i.e., the current date has passed the ETA, the incident row is given a red color. Looking at the page, an analyst can immediately ascertain which incidents need to be resolved within a week, as well as which incidents have missed their deadlines.

Here is the Excel VBA macro code to color code the incident entries:

The Open Incidents page has the following columns (The list below is just a suggestion. You can add/delete as many columns as you want):

Rank: Out of all the incidents, which incident should be tackled foremost. Also, provides a way to sort all the incidents as management may wish.

Priority: Based on three categories - High, medium and low - which group of incidents should be worked on first.

Ticket Number: Every incident should be tagged with a ticket number for tracking and audit purposes.

Date Opened: When the incident was first reported.

Description: A brief description of the incident. Try to make it as descriptive as possible.

Business Owner: The unit that owns the incident or is the most impacted by it.

Assigned to: The person(s) who will be responsible for making the functional change.

ETA: The expected date when the functional change will be made.

Updates: This is probably the most important and useful section. Put a concise status of the open incident preceded by a date.

Impact: What system(s) are impacted by the functional change.

Severity level: How severe the open incident is (i.e., high, medium, low). It is important to fill out this field, because the summary table calculates the incidents by category from this field.

Status: Whether the status of the incident is open or closed. If the incident is listed in this page, the status should always be 'Open'.

Resolution: How the incident was resolved. If the incident is listed in this page, this field should remain blank.


The Closed Incidents Page
Finally, when an incident has been resolved or a functional change made, move the entire row from the Open Incidents page and transfer it to the Closed Incidents page. Fill out the resolution field. It is also important to change the status field from 'open' to 'closed', because the summary page calculates the number of closed incidents from this value.


You can also create a page for action items, which are system improvements that come up during discussion. These changes do not need to be worked on right away, but can be implemented during a future release.

Saturday, March 6, 2010

Seasonal Adjustment Factors for Time Series Analyses

The U.S. Census Bureau provides seasonal adjustment factors for 20 different industries. Using SAS, you can directly read in those adjustment factors into your program from the census bureau website. Here is the code:

filename adjf url 'http://www.census.gov/retail/marts/www/download/text/adv44000.txt';
data seasonal_adjustment_factors;
infile adjf firstobs=26;
input year jan feb mar apr may jun jul aug sep oct nov dec;
if year = . then delete;
run;


The output is shown below (in Excel):

In the example above, I'm reading in the seasonal adjustment factors for retail (total). Pick the code for your industry from the list below, and substitute it with the red text in the URL:

Kind Of Business
Retail and Food Services, total - adv44x72
Total (excl. Motor Vehicle) - adv44y72
Retail, total - adv44000
Retail (excl. Motor Vehicle and Parts Dealers) - adv4400a
Motor Vehicle and Parts Dealers - adv44100
Auto, other Motor Vehicle - adv441x0
Furniture and Home Furnishings Stores - adv44200
Electronics and Appliance Stores - adv44300
Building Material and Garden Equipment and Supplies Dealers - adv44400
Food and Beverage Stores - adv44500
Grocery Stores - adv44510
Health and Personal Care Stores - adv44600
Gasoline Stations - adv44700
Clothing and Clothing Accessories Stores - adv44800
Sporting Goods, Hobby, Book, and Music Stores - adv45100
General Merchandise Stores - adv45200
Dept. Stores (ex. leased depts) - adv45210
Miscellaneous Store Retailers - adv45300
Nonstore Retailers - adv45400
Food Services and Drinking Places - adv72200

So stick this code into your time series model, and you should be good to go. Happy programming!

Wednesday, November 25, 2009

The Coffee Machine At Work

While getting coffee at work, I came across this interesting little problem. The coffee machine gives us two size options - 'Regular' and 'Medium'. I know one option fills my cup, the other option causes it to overflow. My dilemma is choosing the correct option, so my cup doesn't overflow. Of the two options, does Regular imply the larger size and Medium the smaller size? Or does Regular imply the smaller size? I have no way to tell.


If either of the two words were substituted by 'Small' or 'Large', I would have known which option to choose. For example, Between
Large and Regular, I know the large size would provide more coffee. Similarly, if I had to choose between Regular and Small, I would assume Regular would provide more coffee than Small. The same reasoning applies for Large/Medium or Medium/Small. Of all the permutations using the four words (i.e., Large, Medium, Small and Regular), the coffee machine provides the only combination that makes it impossible to figure out the dispensing amount. By the way, for this particular coffee machine, I found out that Regular is larger than Medium.

Saturday, April 4, 2009

Retrieving Data From A Website Into Excel

In this post, I'll show you how to query data from a website using Microsoft Excel. In this example, we will be extracting the stock quote and relevant information for Macy (NYSE:M) from the Yahoo! finance page. First, launch Excel. From the Data taskbar, select Import -> External Data -> New Web Query.


The web query will open a window. In the address section (look for the first red circle), type in the web address. Here I typed in "http://finance.yahoo.com/q?s=M", which is the address for looking up the stock quote for Macy's in Yahoo! finance. Click on Import (the second red circle).

Excel will give you the option to output the data in the existing spreadsheet or a new spreadsheet. Make your choice and click on OK.

Now you should have the data in your Excel spreadsheet. You can analyze the data as you wish.


You can save this entire process in a macro, and launch it with the press of a button. Depending on how you design your macro, you can kick off the process everyday and get the most current information.


You can even have SAS kick off this macro, and read in the data from the Excel spreadsheet. Using this method, you can write a SAS program - maybe to analyze a particular stock - which can pull data from a finance website for that stock. Please see my post on August 27, 2008 (Tools of the Trade V: Kicking Excel VBA Macros From SAS) on how to launch Excel macros from SAS, and see my post on December 29, 2007 (Tools of the Trade II: Using SAS to Extract the Data) on how to read in data from Excel into your SAS program.


Sunday, October 12, 2008

How to Zip and Unzip Large Datasets in SAS

Even today, memory comes at a premium. If your SAS program is generating very large dataset(s), making it problematic for you to store and retrieve using the available memory space at your disposal, you can have your SAS program zip the dataset(s) using the code below:

%sysexec %str(cd /rahman/directory;
gzip filename1..sas7bdat;);


If your program needs to read in the zipped dataset(s) at a subsequent stage, you can unzip the dataset(s) in your program using the code below:

%sysexec %str(cd /rahman/directory;
gunzip
filename1..sas7bdat.gz;);

Sunday, September 14, 2008

Making SAS programs run faster

An alternative title for this post could have been ways to avoid sorting your data. Sort procedures in SAS are notorious memory hogs, and can radically slow down your program. Therefore, whenever you're able to avoid sorting a data set, do so. It makes your SAS programs run much faster. Also try to eliminate as many data steps as you can. The following methods can be used to improve the efficiency of your programs:

Indexing

An index is an optional data file created for a SAS data set to provide direct access to specific observations within the data set. The index file consists of entries that are organized in a tree structure, and connected by pointers. Your program knows where to look, and avoids a wasting a lot of time skimming through unnecessary data. Indexes can be created in a data step or an SQL statement.

Used the following code to create an index in a data step:

data flights
(index = (origin /* Creating a simple index */
dteflt = (fltDate flightID/unique)); /* Creating a composite index */
infile 'UPS_FLIGHTS.dat';
input flightID $7. routeID $7. fltDate date9. origin $3. dest $3. distance 8.
;
run;


Later, after you're finished with that piece of code and you want to delete the index:

proc datasets library = work nolist;
modify flights;
index delete
origin;
index delete
dteflt;
quit;


Use the following code to create an index in a SQL statement:

proc sql;
create index origin
on flights (origin);
create unique index dteFlt
on flights (fltdate, flightID);
quit;


If you want to delete the index in a SQL statement:

proc sql;
drop index origin
from flights;
drop index dteFlt
from
flights;
quit;


Conditional Merges

Conditional merges are more complicated than conventional merges. In certain instances, however, conditional merges can work much faster than conventional merges.

A conditional merge matches observations in a secondary dataset with the observations in a primary dataset. The merge steps through the primary dataset one observation at a time, seeking “matching records” in the secondary dataset.

This matching is done within the context of an ‘Event Segment’. An event segment can be defined as the set of observations in the primary dataset which shares the same values with the observations belonging to the secondary dataset for a given number of variables (i.e., trade date, issue, firm, etc.). A set of rules within the event segment allows the records from the secondary dataset to merge with the records from the primary dataset.

In our example, we created five new variables to facilitate the conditional merge logic:

FirstZ – The FirstZ variable indicates the start of an event segment.

NextZ – The NextZ variable indicates where the pointer within a particular event segment.

Zloc The Zloc variable indicates whether the record for the secondary dataset is before, in or after a particular event segment.

Continue – The Continue variable tells the whether to process the data (i.e., execute event segment rules) within an event segment or move to the next event segment. Continue set to ‘1’ implies that the secondary record is still within the event segment, and the processing should continue. Continue set to ‘0’ implies the pointer for the secondary record is after the event segment, and processing should start for the next event segment.

Noobs - Number of records in the secondary dataset for a particular event segment.

In the conditional merge, the records in the secondary dataset are merged to that of the primary dataset by the set of common variables (which also determine the event segment). If the values belonging to any of these variables in the secondary dataset are less than that of the primary dataset, Zloc is given a value of ‘-1’. If the value is greater, Zloc is given a value of ‘1’. If the values are the same, Zloc is given a value of ‘0’.

Zloc equals ‘-1’ implies that the pointer for the secondary record is before the event segment. The value for NextZ is incremented until it matches the value for FirstZ (Start of the event segment). When NextZ exceeds the number of records in the secondary dataset for the event segment, Continue is reset from ‘1’ to ‘0’ prompting the pattern to evaluate the next event segment. FirstZ (i.e., start of the next event segment) is reset to correspond with NextZ.

If Zloc equals ‘1’, the pointer for the secondary record is below the end to the event segment. Continue is reset to ‘0’ prompting the pattern to evaluate the next event segment. NextZ is reset to correspond with FirstZ (i.e., start of the next event segment).

If Zloc equals ‘0’, the pointer for the secondary record is within the event segment. During this stage, the merge will execute any rules specified within the event segment. For example, if there is a rule to put a new value for a field (i.e., Change ‘N’ to ‘Y’ for a Flag) when the primary and secondary datasets variables (i.e., Sell Date = Buy Date) are the same, that rule will be executed within the event segment. The pointer for the secondary record is also incremented by 1, causing the pointer to move to the subsequent secondary record.

At the end of the conditional merge, we should have a dataset which has all the primary records aligned with the secondary records that satisfy the rules within a particular event segment.


The code of a condition merge is given below:

data merged_data (drop=firstZ continue Zloc [any columns you don’t need to output]);
retain nextZ 1 firstZ 1 Zloc break 0;

set primary_data;
by pdate pitem ptime pprice;

continue = 1;

do while (continue=1 and nextZ<=Zcount);
set secondary data
nobs=Zcount point=nextZ;

if sdate LT pdate then Zloc = -1;
else if sdate GT pdate then Zloc = 1;
else do;
if sitem LT pitem then Zloc = -1;
else if sitem GT pitem then Zloc = 1;
else do;
if stime LT pitem then Zloc = -1;
else if stime GT pitem then Zloc=1;
else Zloc = 0;
end;
end;

/* before window, step forward in secondary unless at end */
if Zloc = -1 then do;
if nextZ LT Zcount then nextZ + 1; else continue = 0;
firstZ = nextZ;
end;

/* after window, reset the cursor to start of window and do next primary */
if Zloc = 1 then do;
continue = 0;
nextZ = firstZ;
end;

/* in window, step thru, check logic, but leave the cursor as is */
if Zloc = 0 then do;

/*Put business logic here*/

If sprice GE pprice + (pprice*0.1)
if nextZ LT Zcount then nextZ + 1; else continue = 0;
end;
end;

if sprice GE (pprice + (pprice*0.1)) then do;
output;
end;

run;


Hash Objects

Hash objects are a new addition to SAS, and are supposed to speed up your program while making the most efficient use of memory. An unfortunate drawback of this technique is that has hash objects cannot be used in SQL statements, only in data steps. In the example below, we are trying to merge the variables for the participant data set with those in the weight table. The merged data set is called results. If we try to perform a conventional merge procedure, we would have create two additional data steps to sort the participants and weight data sets by name, thus causing the program to require more memory as well as increasing its run time.

data participants;
input name $ gender $1. treatment $;
datalines;
John M Placebo
Ronald M Drug_A
Barbara F Drug_B
Alice F Drug_C
;

data weight (drop = i)
input data DATE9. @;
do i to 4;
input name $ weight @;
output;
datalines;
05MAY2006 Barbara 125 Alice 130 Ronald 170 John 160
04JUN2006 Barbara 122 Alice 133 Ronald 168 John 155
;

data results;
length name treatment $ 8 gender $ 1;
if _n_ = 1 then do;
declare hash h (dataset: 'participants');
h.defineKey('name');
h.defineData('gender','treatment');
h.defineDone();
end;
Set weight;
if h.find() = 0 then
output;
run;

proc print data = results;
format date DATE9.;
var date name gender weight treatment;
run;


Format tables

Format tables are similar to hash objects, although slightly trickier to implement. This method requires an additional step, which is creating the format table. Subsequently, the values of the format table can be appended to a dataset based on a key variable that resides in both format table and dataset, similar to the hash object shown above. In the example below, we use the format procedure to add the names of the stock symbols to the indat dataset, and calculate the count of stock issues. Alternatively, we could have sorted both the indat dataset and a dataset containing the issue names, merged them together and performed a summary or means procedure to get the number of issues. Our method eliminated two sort procedures, one merge procedure and one summary/means procedure. When analyzing millions of records, time and memory space savings from eliminating four procedures can be significant.

First, read in your data set.

data indat;
input @1 name $3. @5 ask 5.2 @11 bid 5.2; cards;
IBM 16.25 16.12
AOL 17.00 17.06
AOL 16.25 13.02
IBM 16.25 16.05
IBM 18.25 17.02
FNM 18.00 18.06
FNM 18.25 17.02
FRE 18.25 17.02
;
run;


Second, create your format table.

proc format;
value $Symbol
'IBM'='IBM'
'AOL'='America Online'
'FNM'='Fannie Mae'
'FRE'='Freddie Mac';
run;


When performing your analyses, recall the values from your format table.

proc freq data=indat;
tables name /list;
format name $Symbol.;
title "Issue Count";
run;

Wednesday, August 27, 2008

Tools of the Trade V: Kicking Excel VBA Macros from SAS

The code below enables SAS programs to launch Excel VBA macros. Let's assume that you have an Excel Spreadsheet named Indat.xls that contains a macro which generates a bar chart when certain cells are populated. You have named the macro ShoChrt. Use the following code to populate the necessary cells and launch the ShoChrt Macro:

The first step is assigning the file references to the Excel spreadsheet containing the VBA macro(s), and opening the spreadsheet.

options xsync;

filename EXCEL DDE 'EXCEL|SYSTEM';
filename EXPORT DDE 'EXCEL|Sheet1!r1c1:r2c6' notab ;

data _null_;
file excel;
put '[open("C:\TEST\INDAT.XLS")]';
run;

Write the code to perform your analyses in SAS.

/* Perform your analysis in SAS */
proc summary data = indat nway; class size;
var price;
output out = outdat sum=;
run;
Export your output data to Excel.

data _null_;
set outdat;
tab = '09'x;
file EXPORT;
run;

The SAS code below will kick off the VBA macro(s).

/* Execute the previously created VBA macro named 'SHOCHRT' */
data _null_;
file excel;
put '[RUN("ShoChrt")]';
run;

Finally, the code below will remove the file references for your Excel spreadsheet(s).

filename EXCEL clear;
filename EXPORT clear;


Note: If you have any problems launching the Excel file using the code above, try this block of code instead:

options noxwait noxsync;
x '"c:\program files\microsoft office\office11\excel.exe"';

data _null_;
x=sleep(5);
run;

filename excel DDE 'EXCEL|SYSTEM';

Wednesday, July 23, 2008

Tools of the Trade IV: Using SAS to Output the Data

We will be using SAS to output data in different formats.

Output to a text file
This is the most basic and popular way to output data from a SAS program. The code below will create the header for your dataset:

Data _null_;
file "c:\Item_List.txt" lrecl = 150;
put
@1 "Product"
@10 "Type"
@20 "Service"
@30 "Price";
run;


This code will let you output the contents of your dataset:

Data _null_;
file "c:\Item_List.txt" mod lrecl = 150;
set ItemList;
put
@1 product
@10 type
@20 service
@30 price;
run;


To directly output a SAS dataset into a spaced tab text file, use the following procedure:

PROC EXPORT DATA= WORK.ItemList
OUTFILE= "C\Item_List.txt"
DBMS=TAB REPLACE;
RUN;


To output a SAS dataset into a delimited text file, use the following procedure:

PROC EXPORT DATA= WORK.ItemList
OUTFILE= "C:\Item_List"
DBMS=DLM REPLACE;
DELIMITER='00'x;
RUN;


Output data to *.csv file
To output data to a *.csv file, use the following procedure:

PROC EXPORT DATA= WORK.ItemList
OUTFILE= "C:\Item_List.csv"

DBMS=CSV REPLACE;
RUN;


Output data to an Excel file
There are several ways to output SAS datasets to an Excel spreadsheet. The following code will dump the data into your Excel spreadsheet, but you'll need to keep the spreadsheet open:

filename toexcel dde "excel|Sheet1!r2c1:r30000c11";
data _null_;

file toexcel dlm='09'x notab;

set Final_Data;

put Date Day Train Orig Dest Pallets Footage;

run;


This SAS macro allows you more flexibility to output your data. You can specify the columns and rows of your spreadsheet where you want to output the data:

%macro m_xlout(sheet, tbl, ds, var, row1, col1, row2, col2);

filename tmp dde "excel|[&sheet.]:&tbl.!r&row1.c&col1.:r&row2.c&col2.";

data _null_;

set &ds.;

file tmp;

put &var.
;
run;


%mend m_xlout;

%m_xlout(UtilizationRates.xls, Utilization Details, facilities, route trip orig dest arrivl utiliz, 5, 2, 16000, 7);


Finally, if you just want to dump the entire SAS dataset into an Excel spreadsheet, use the following procedure:

PROC EXPORT DATA= Final_Data
OUTFILE= "C:\Final Data.xls"

DBMS=EXCEL2000 REPLACE;

RUN;


Output data in HTML
Here is a quick and dirty way to output SAS data in HTML format:

filename odsout "C:\Outputs\Analytics Dashboards"
ods html path=odsout
body="Dashboard reports.html"
nogtitle;

proc summary data=indat;
var revenue;
output out=outdat sum=;
proc print;
title "Summary of Premier Transactions";
run;

ods html close;
ods listing;
title;


The printouts between
ods html path and ods html close statements will appear in an HTML page in the Analytics Dashboard folder in the C:\ drive.

Saturday, June 21, 2008

Managing Organizational Risk II: Controlling The Systems Flow Process

A significant source of organizational risk is not having sufficient control of the activities and processes within your department or organization. In today's fast paced and rapidly changing environment, significant parts of any process have to be broken down and delegated to various people, often with disparate sets of skills and experience levels. Having several people simultaneously making changes to specific parts of a process in order to make the entire process responsive to a sudden change in the environment can be quite a difficult task; and if not handled properly can (1) result in duplication and waste of valuable work hours, (2) create confusion and breed hostility in the workplace, (3) cause the organization to fail to respond to the crisis that prompted the process change exercise, or even (4) muddle or damage the existing process. The steps below provide a generic approach to manage changes in the organizational systems flow process:

Figure 4.1 : Controlling the systems flow process.


Step 1
The first step is to baseline the processes within your organization. Accumulate documentation on existing processes. If documentation is lacking, interview the relevant people and ask them to document their processes. Make sure that these documents are complete and detailed enough for other people to execute. Create a master document of how these processes work together(i.e., The Master Strategy document).

Step 2
Any change to the process (or part of a process) should only be initiated via a written request. Subsequently, The request's feasibility and viability should be evaluated after it has been received, granted that requests for certain processes would go through a more rigorous evaluation than others. It is not a good idea to make changes to a process, or part of a process, without some sort of a document trail.

Step 3

After the request has been received and evaluated, the next step is to determine whether your department has a pre-existing methodology to handle the change request. Often many of the change requests received are of a recurring nature, your organization may have an existing methodology to handle the change. This is another reason why documentation is important.

Step 4a
If a methodology exists for the change request, you need to verify whether it is sufficient for the request. You may need to make minor modifications to the methodology to adhere to a specific request.

Step 4b
If a methodology does not exist, you need to develop a new one to manage the change request. When developing the new methodology, you need to be cognizant of the fact that it may affect methodologies belonging to other systems, and even require you to develop additional methodologies. Also, you will need to design tests for the newly developed methodology to ascertain that it provides accurate and consistent results.

Step 5
Once you have tested and are fairly confident about performance of the new methodology, the next step is to execute it within the process and validate the outcome. Inform other stakeholders about the changes that have been implemented within the process.

Step 6
After the change request has been completed, the next step is to update the Master Change document. The Master Change document maintains a continuous list of changes that are made to any of the processes for future reference.

Step 7

Determine whether the change request should be part of a broader strategy.If so, update your Master Strategy document.

Step 8
The final step is to develop and execute a post implementation validation plan for the new strategy. The purpose of this plan is to make sure that the outcome of the new changes remain accurate and consistent over time.

Sunday, May 11, 2008

Tools of the Trade III: Simple Data Validation Procedures

The reliability of your analytical model depends to a great extent on the quality of its underlying data. Unfortunately, bad data is a prevalent problem for most corporations. A survey by Gartner found that at least 25 percent of all data for Fortune 1000 firms were bad or corrupted. Based on my experience, carrying out several simple procedures after reading in the data will let you track and rectify many of these data quality problems, even if you don't get 100 percent accuracy. If you are getting your data from an outside source, it is a good idea to share your findings from the data validation procedures with it. The people providing you the data may be able to tell you whether your preliminary findings make sense or needs further investigation. Carry out these procedures, even if you have assurances that the data is good and complete. These simple - yet effective - procedures include the following:

1. Prior to performing any analyses, pull out the first and last 15 observations of the data and look for any obvious inconsistencies. Examine columns with blanks and null values. Check and see whether the values for a variable make sense (i.e., a column that should have numeric values, such as price, does not contain numeric values).

2. If using SAS, perform a contents procedure on the dataset to see if all the variables are accounted for in the proper format. Date and Time are often the trickiest variable. Make sure whether they are in time, timestamp or character format. IDs are another problematic variable. Generally, they should be in character format (even if they are numbers), but often exist in numeric format.

3. Verify the number of records you read into your program. Investigate if you have more (often resulting from trailing blanks) or less records (records getting dropped by the read in program) than anticipated. Trailing blanks are not harmless and may cause your program to malfunction during later stages of your analyses.

Try not to eliminate any records. Save the bad records in separate datasets for further analyses. These records often provide valuable clues for future QA strategies.

4. Make sure the data falls within valid ranges. For instance, if you know the age of people in the dataset should not be less than 18 years or more than 65 years, all the DOB should be within that range. If you know that the highest and lowest unit prices in your dataset are $100 and $0.10 respectively, then seperate and study records where unit prices are above $100 or less than 10 cents.

5. Perform a frequency on key variables. A frequency on dates could show records missing for an entire day. Also, pay attention to dates equavalent to default dates (i.e., Jan 1, 1900 for Excel and Jan 1, 1960 for SAS). Make sure there are no blanks when there should be null values, and vice versa.

6. Randomly pull 15 records from the entire dataset and ascertain that there are no egregious errors.

7. Read out the records with the 10 highest and lowest values for key variables.

8. Output the mean, median and mode for key variables.

Save your data validation results. Comparing the different findings over time should enable you to identify and correct data problems.

Using SAS to compare two datasets

You can use the SAS compare procedure to validate a dataset by comparing it with a baseline dataset. Use the following code to compare two identical datasets:

proc compare base=indat1 compare=indat2 OUTSTATS=outdat1 noprint;
run;

This is helpful when you need to modify an existing SAS program, but do not want the modifications to change the output.

Tuesday, April 15, 2008

Managing Organizational Risk I: How To Deal With Transactional Fraud

If you read the newspapers or watch the news, you are probably aware that transactional fraud has been increasing exponentially and will continue to do so in the near future. According to a Nelson report, financial institutions and online merchants have lost over $ 1.2 billion in 2005 alone. Transactional fraud, as opposed to regular fraud, occurs when a credit card holder or online account holder denies authorizing or engaging in transaction(s) involving his/her credit card or account. This narrow definition excludes other instances of fraud from the purview of “transactional fraud”. If a customer, for instance, authorizes a transaction to purchase an item from a vendor, and the vendor intentionally delivers a lower quality product to the card member, that particular action will not fall within our definition of transactional fraud. Such cases should be referred to the organization's disputes division, or the affected person should pursue legal action against the vendor. In order to be classified as transactional fraud, the customer must deny authorizing or engaging in that particular transaction with the vendor.

Scenario #1: Customer calls to inform that he entered into a contract with a vendor to purchase merchandise. Vendor charges bill to customer’s credit card but does not deliver merchandise. Since customer authorized the transaction, this case does not fall within the purview of transactional fraud. Customer is referred to the billing disputes department.

Based on this narrow definition of transactional fraud - it becomes critical for companies to properly establish the identity of the customer - often over the phone. As a result, any strategy to deal with transactional fraud often includes a investigator or telephone rep who calls up the customer and tries to determine whether that person is the actual card holder or online customer. Helpfully, there are various identity verification tools in the market, and an investigator would avail several of these tools in conjunction to design tests that the customer needs to pass in order to prove his or her identity. Credit rating bureaus, such as Experian and Transunion, offer several of these verification tools, which include:

  • Fast Data: Allows investigators to verify past and present addresses and phone numbers for a customer.

  • First Pursuit: Provides data from the credit rating bureaus for a credit card holder.

  • GUS: Allows investigators to view application and credit bureau data for a credit card holder.

  • MARS: Allows investigators to view information on other accounts linked to a credit card holder.

  • VERID: Enables an investigator to establish the identity of a credit card holder by asking a series of questions that only the card holder would know.

  • VRU: Enables an investigator to see all the phones numbers that were used to inquire about a particular account or transaction.

In addition, many internet security firms allow companies to trace computer IP addresses that may be used commit transactional fraud via the internet. Your company should also have the ability to allow investigators query information from your company databases as well as create and maintain memos for accounts that have been "touched". Often, past information pertaining to a specific account becomes crucial to identify fraud or foul play. There are also software applications in the market, such as Falcon offered by Fair Isaacs and Fraud Management offered by SAS, that can analyze millions of transactions in real time and generate alerts on suspicious account activity based on predetermined rules.

Depending on how the alerts are generated or brought to your attention, the procedures for managing transactional fraud can be grouped into two main strategies: (1) Inbound and (2) Outbound. Both these strategies are further discussed below:

Inbound Fraud Strategies

These strategies are employed when a customer calls your organization to complain about potential fraud activity on his account. Companies often set up several groups to manage the flow of inbound fraud cases:

The Primary Inbound Fraud Unit: The primary inbound fraud unit is the gateway for handling potential inbound fraud cases. These cases may arrive at the inbound unit from different departments of your organization, such as Customer Services, Billing Disputes, Collections, etc. A customer may personally call your fraud department to report fraudulent activity on her account. Many outbound fraud strategies may place a temporary block on the account that may prompt the customer to call your company. After receiving the call, an investigator performs a quick series of verification tests on the customer to ascertain her identity utilizing one or more of the validation tools described above. If the investigator ascertains that no transactional fraud was committed, he will fill out a memo explaining his findings and close the case. Future investigators who pull up the account would access to the contents of this memo. If the investigator, however, suspects that transactional fraud was committed or the customer fails the verification tests, the account is temporarily blocked and the case is referred to the secondary inbound fraud unit for further investigation.

Scenario #2: Customer calls bank because she can’t use her credit card. Investigation reveals a temporary block placed on the card because a large jewelry purchase in the Bahamas was charged on it. Investigator verifies card holder’s identity and account information, and removes temporary block. Investigator writes up her findings in a memo that will be available to future investigators who pull up the account.

The Secondary Inbound Fraud Unit: Potential fraud cases that have not been resolved at the primary inbound unit and require further investigation are referred to the secondary inbound fraud unit. The secondary inbound fraud investigator, upon receiving the case, would read the memo written by the primary inbound investigator, and perform further verification tests on the customer. Secondary inbound investigators are more experienced people who have doing this kind of work for a while. The investigator would then place a call to the customer to gather more information on the incident. If the investigator resolves the case, he removes the block from the account and records his findings in a memo. If the investigator suspects the case involves fraud, he places a permanent block on the account and fills out a fraud application. The case then gets referred to the investigations division. Permanent blocks are more difficult to remove than a temporary block.

Scenario #3: Customer calls bank to inquire about a credit card statement she received for a card that she did not apply for. Investigations reveal suspect(s) intercepted credit card offer letter, opened account and transferred large amounts of cash to their account. Customer is advised to contact credit rating agency and file a police report. Investigator puts a permanent block on the account and fills out a fraud application. Customer has no liability for money stolen.

Scenario #4: Customer was subscriber to a large Internet Service Provider (ISP). Customer claims to have called ISP to cancel service two years ago. ISP did not cancel service and was billing customer for two years. The charges appeared on the customer’s credit card statement for the past two years. Customer called ISP to get charges reimbursed. ISP refused to reimburse charges. Customer called bank to claim credit card fraud. Case is not fraud because customer had initially authorized charges and was not diligent in ensuring that the ISP had actually canceled service. The case is referred to the billing disputes department.


Figure 3.1: How a large commerical bank handles inbound fraud.

Outbound Fraud Strategies

These strategies are employed to deal with transaction fraud when the potential fraudulant activity is brought to your attention other than the customer calling your organization. Potential fraud activity can be brought to your attention from transactions pertaining to "compromised" accounts (i.e., accounts that are known to be stolen), credit rating bureaus, electronic fraud detection systems such as Falcon, etc. In many cases, accounts that are potential fraud cases have a temporary block placed on them. As with the inbound fraud strategies, the outbound fraud strategies can consist of various stages and groups to better classify and resolve the potential fraud cases. For example, you can have a primary outbound fraud unit that analyzes the preliminary outbound fraud cases and routes them to a group that specializes in a specific fraud type, such as Takeover or NRI.

The Primary Outbound Fraud Unit: After the investigator receives the potential fraud case, he performs a series of verification tests on the customer and account using the available validation tools. One of these tests often involve a process called Trending, where the investigator tries to determine at least three matches for a customer from the customer's personal information (i.e., phone numbers, SSN, driver’s license, etc.) stored in different systems. The investigator would then place a call to the customer. The investigator may request additional documentation from the customer to validate his identity. If the investigator is able to determine no transactional fraud was involved, he would remove the temporary block, record his findings in a memo, and close the case. If the case involves transactional fraud, the investigator will check the outstanding balance on the account. If the outstanding balance is zero, the investigator would put a permanent block on the account. If the outstanding balance on the credit card is positive, the case is referred to the secondary outbound group for further analyses. If the investigator is unable to get hold of the customer, he leaves a message and a contact phone number. When the customer calls, her case is handled by the inbound group, which has access to the outbound investigator's memos pertaining to the account.

Because you do not have an impatient customer on the line and more time to research the potential cases, outbound fraud strategies can also be tailored to respond to specific fraud types, such as:

i. Fraud Applications: Cases where perpetrators steals a victim’s personal information and use it to open an account.

Scenario #5: Credit Card issued from bank in high risk area (this particular branch has issued credit cards to fraudulent applicants in the past) and customer fails VERID test. Since account has positive balance, case is referred to the secondary outbound unit for further investigation.

ii. Takeover: Cases where the the suspect steals the identity and account belonging to a customer and commits fraud. For credit cards, the phone number used by a suspect to activate the card or inquire about the account is used to determine whether fraud is being committed.

Scenario #6: Customer lives in Los Angeles, but the call to activate the credit card was placed from Texas. Investigator calls customer, and customer states that he has a cell phone with a Texas area code. Customer passes VERID. Case is not fraud.

Scenario #7: Customer’s ex-husband steals credit card and purchases items from a major retailer. This is takeover fraud because the suspect stole both the customer’s identity and account. Investigator fills out fraud card, puts a permanent block on the account, and updates the card member’s information in the system.

iii. NRI (Never Received Issue): Cases where the perpetrators intercept the credit card before it reaches the customer and commits fraud.

Scenario #8: Card member applied but did not receive credit card. Since credit card account has zero balance, the investigator puts a permanent block on the credit card account and fills out a fraud card. Investigator also initiates the process to get customer a new credit card account.

Scenario #9: Customer applied for a credit card, but claims to have never received the card. However, the card was activated from his home phone. Customer claims to have not been in his apartment during that period. Investigator requests customer to provide additional documentation to establish identity and presence, and refers case to the Investigations Division.

iv. CNP (Card Not Present): The suspects use credit or debit account information without the physical card being involved, usually through e-mail or other electronic means.

Scenario #10: Customer lists wrong home number, but uses the correct PIN to withdraw more cash than her credit limit. Outbound unit investigator performs verification tests and calls card member. Card member passes VERID. Case is not fraud.

Scenario #11: Electronic surveillence system detects a newly opened account making a $10 purchase at the website of a well known electronics merchant followed by a $6000 purchase within 30 minutes. Investigator unable to get hold of customer using the information provided. Account is blocked. Customer never calls back. Case is considered fraud.

The Secondary Outbound Fraud Unit: Potential outbound fraud cases that have not been resolved at the primary outbound unit and have positive balances are referred to secondary outbound fraud unit. The secondary outbound investigator, upon receiving the case, would read the memos written by the investigators from previous unit(s), and perform further verification tests on the customer and account. If the investigator is able to determine that the case does not involve transactional fraud, he removes the temporary block on the account, makes the necessary credit adjustments, and updates the customer's information in the systems belonging to various credit rating agencies. If the investigator is unable to resolve the case or suspects that fraud is involved, he puts a permanent block on the account, requests the customer for further documentation to establish his identity and sends the case to the investigations division.

Evident from the process described above is that investigators - working both the inbound and outbound strategies - go great lengths to establish the identity of the customer or card holder. By establishing the identity of the customer and ensuring he or she approved the transaction, the company can often defer the monetary loss (based on contractual agreements) accrued on that account or credit card to other entities. Hence, for your company, customers who protect themselves against identity theft are still your best line of defense against transactional fraud.
By taking the following basic precautions, customers can protect themselves against identity theft, as well as greatly enhance the effectiveness of your transactional fraud prevention strategies:
  • Never give out personal information over the phone, over the internet or through the mail unless the customer initiates the transaction or knows who he or she is dealing with.
  • Protect mail. Get incoming mail in a locked mailbox or slot. Take outgoing mail to a postal mailbox or the post office. If mail suddenly stops, go to the post office. Thieves sometimes submit change of address forms to divert mail to their addresses.
  • Check bank and credit card statements carefully. If there are any problems, report these problems immediately.
  • Use a shredder to destroy papers containing sensitive information, such as account numbers, birth dates, SSNs. Destroy all solicitation letters and balance transfer checks sent from credit card companies.
  • Monitor credit reports. There's a website called FreeCreditReport.com that enables people to do that. Or they could contact the three credit bureaus: Equifax (800-525-6285), Experian (888-397-3742) and Transunion (800-680-7289).
The Federal Trade Commission (FTC) website, http://www.ftc.gov/, offers more information about preventing identity theft and what to do if someone thinks his or her identity has been stolen. The FTC's toll free ID Theft Hotline is (877) ID-THEFT (877-438-4338).