Friday, June 25, 2010

Tracking Incidents And Functional Changes In A System

Over the years, I have worked for quite a few organizations. In any organization, tracking incidents and functional changes in a system is a very challenging task. Unfortunately, most places don't do a good job in tracking these changes. Nevertheless, I found this Excel template to be a very cheap and effective tool for tracking incidents and functional changes in a system.

The tracking document has three main sections. The summary page, the open incidents page(s), and the closed incidents page. If needed, another section can be added for action items. These sections are discussed in detail below:

The Summary Page
The Summary Page has a simple layout that show the number of incidents that are open, and the number of incidents that have been closed. There are additional drill down sections that shows the open incidents for each department (i.e., dept 1, dept 2, etc.). The open incidents for each department is categorized by priority (i.e., High, Medium, Low). The priority count is calculated by a macro that inputs the value directly from the 'severity level' column from a particular department's open incidents page. the closed counts are directly input from the closed incidents page, using an Excel VBA macro.

The page also contains several buttons for ease of use. In the example below, the first two buttons opens the 'Open Incidents' page for their respective departments. The third button opens the 'Closed Incidents' page. The fourth button prints summary page. The fifth button prints out the the entire tracking work book in a predetermined print layout.
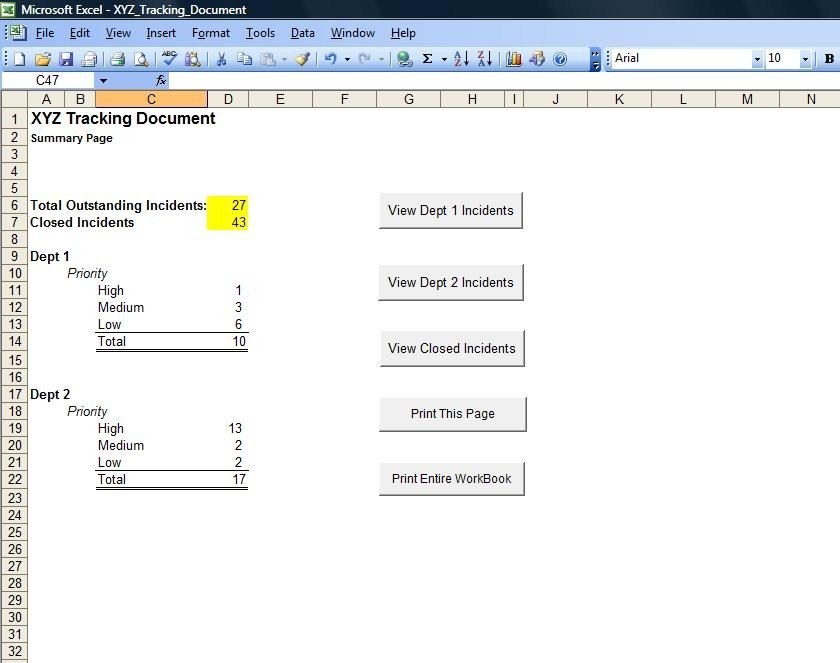


Here is the Excel VBA macro code for calculating incidents in the summary page.

Here is the Excel VBA macro code for the buttons.

Assigning the Excel VBA macro code to the buttons.


The Open Incidents Page
The Open incidents page contain the functional changes that are yet to be completed. Ideally, there should be one Open Incidents page per department.


The incidents are color coded to depict whether the changes are being made on time, or the deadlines are slipping. The color of the row is assigned by a VBA macro that calculates the difference between the expected date (i.e., ETA) and the current date. If the difference between the ETA and current date is seven days or less, the incident row is given a yellow color. If the ETA has been missed,i.e., the current date has passed the ETA, the incident row is given a red color. Looking at the page, an analyst can immediately ascertain which incidents need to be resolved within a week, as well as which incidents have missed their deadlines.

Here is the Excel VBA macro code to color code the incident entries:

The Open Incidents page has the following columns (The list below is just a suggestion. You can add/delete as many columns as you want):

Rank: Out of all the incidents, which incident should be tackled foremost. Also, provides a way to sort all the incidents as management may wish.

Priority: Based on three categories - High, medium and low - which group of incidents should be worked on first.

Ticket Number: Every incident should be tagged with a ticket number for tracking and audit purposes.

Date Opened: When the incident was first reported.

Description: A brief description of the incident. Try to make it as descriptive as possible.

Business Owner: The unit that owns the incident or is the most impacted by it.

Assigned to: The person(s) who will be responsible for making the functional change.

ETA: The expected date when the functional change will be made.

Updates: This is probably the most important and useful section. Put a concise status of the open incident preceded by a date.

Impact: What system(s) are impacted by the functional change.

Severity level: How severe the open incident is (i.e., high, medium, low). It is important to fill out this field, because the summary table calculates the incidents by category from this field.

Status: Whether the status of the incident is open or closed. If the incident is listed in this page, the status should always be 'Open'.

Resolution: How the incident was resolved. If the incident is listed in this page, this field should remain blank.


The Closed Incidents Page
Finally, when an incident has been resolved or a functional change made, move the entire row from the Open Incidents page and transfer it to the Closed Incidents page. Fill out the resolution field. It is also important to change the status field from 'open' to 'closed', because the summary page calculates the number of closed incidents from this value.


You can also create a page for action items, which are system improvements that come up during discussion. These changes do not need to be worked on right away, but can be implemented during a future release.

Saturday, March 6, 2010

Seasonal Adjustment Factors for Time Series Analyses

The U.S. Census Bureau provides seasonal adjustment factors for 20 different industries. Using SAS, you can directly read in those adjustment factors into your program from the census bureau website. Here is the code:

filename adjf url 'http://www.census.gov/retail/marts/www/download/text/adv44000.txt';
data seasonal_adjustment_factors;
infile adjf firstobs=26;
input year jan feb mar apr may jun jul aug sep oct nov dec;
if year = . then delete;
run;


The output is shown below (in Excel):

In the example above, I'm reading in the seasonal adjustment factors for retail (total). Pick the code for your industry from the list below, and substitute it with the red text in the URL:

Kind Of Business
Retail and Food Services, total - adv44x72
Total (excl. Motor Vehicle) - adv44y72
Retail, total - adv44000
Retail (excl. Motor Vehicle and Parts Dealers) - adv4400a
Motor Vehicle and Parts Dealers - adv44100
Auto, other Motor Vehicle - adv441x0
Furniture and Home Furnishings Stores - adv44200
Electronics and Appliance Stores - adv44300
Building Material and Garden Equipment and Supplies Dealers - adv44400
Food and Beverage Stores - adv44500
Grocery Stores - adv44510
Health and Personal Care Stores - adv44600
Gasoline Stations - adv44700
Clothing and Clothing Accessories Stores - adv44800
Sporting Goods, Hobby, Book, and Music Stores - adv45100
General Merchandise Stores - adv45200
Dept. Stores (ex. leased depts) - adv45210
Miscellaneous Store Retailers - adv45300
Nonstore Retailers - adv45400
Food Services and Drinking Places - adv72200

So stick this code into your time series model, and you should be good to go. Happy programming!

Wednesday, November 25, 2009

The Coffee Machine At Work

While getting coffee at work, I came across this interesting little problem. The coffee machine gives us two size options - 'Regular' and 'Medium'. I know one option fills my cup, the other option causes it to overflow. My dilemma is choosing the correct option, so my cup doesn't overflow. Of the two options, does Regular imply the larger size and Medium the smaller size? Or does Regular imply the smaller size? I have no way to tell.


If either of the two words were substituted by 'Small' or 'Large', I would have known which option to choose. For example, Between
Large and Regular, I know the large size would provide more coffee. Similarly, if I had to choose between Regular and Small, I would assume Regular would provide more coffee than Small. The same reasoning applies for Large/Medium or Medium/Small. Of all the permutations using the four words (i.e., Large, Medium, Small and Regular), the coffee machine provides the only combination that makes it impossible to figure out the dispensing amount. By the way, for this particular coffee machine, I found out that Regular is larger than Medium.

Saturday, April 4, 2009

Retrieving Data From A Website Into Excel

In this post, I'll show you how to query data from a website using Microsoft Excel. In this example, we will be extracting the stock quote and relevant information for Macy (NYSE:M) from the Yahoo! finance page. First, launch Excel. From the Data taskbar, select Import -> External Data -> New Web Query.


The web query will open a window. In the address section (look for the first red circle), type in the web address. Here I typed in "http://finance.yahoo.com/q?s=M", which is the address for looking up the stock quote for Macy's in Yahoo! finance. Click on Import (the second red circle).

Excel will give you the option to output the data in the existing spreadsheet or a new spreadsheet. Make your choice and click on OK.

Now you should have the data in your Excel spreadsheet. You can analyze the data as you wish.


You can save this entire process in a macro, and launch it with the press of a button. Depending on how you design your macro, you can kick off the process everyday and get the most current information.


You can even have SAS kick off this macro, and read in the data from the Excel spreadsheet. Using this method, you can write a SAS program - maybe to analyze a particular stock - which can pull data from a finance website for that stock. Please see my post on August 27, 2008 (Tools of the Trade V: Kicking Excel VBA Macros From SAS) on how to launch Excel macros from SAS, and see my post on December 29, 2007 (Tools of the Trade II: Using SAS to Extract the Data) on how to read in data from Excel into your SAS program.


Sunday, October 12, 2008

How to Zip and Unzip Large Datasets in SAS

Even today, memory comes at a premium. If your SAS program is generating very large dataset(s), making it problematic for you to store and retrieve using the available memory space at your disposal, you can have your SAS program zip the dataset(s) using the code below:

%sysexec %str(cd /rahman/directory;
gzip filename1..sas7bdat;);


If your program needs to read in the zipped dataset(s) at a subsequent stage, you can unzip the dataset(s) in your program using the code below:

%sysexec %str(cd /rahman/directory;
gunzip
filename1..sas7bdat.gz;);