skip to main |
skip to sidebar
Google blogger has a neat aspect, that not only provides feedback on the number of site visits, but shows the operating system, type of browser, and originating countries for those visits. I find the world map to be a nifty feature. Without further ado, here are some figures on site traffic to my blog.Last month (October 7, 2010 to November 5, 2010), there were 808 visits to my blog (Not a lot I know, but I wasn't sure whether anyone was even reading my blog). The visits came from a total of 10 countries: USA, Canada, France, Netherlands, Poland, Israel, India, Pakistan, China and South Korea. Not surprisingly, the majority of hits came from the U.S.(97.5%). Encompassing 98% of all traffic, Microsoft Windows was the overwhelming operating system (OS) used to access my blog. Apple's Macintosh OS was in second place involving less than 1% of traffic. There was one instance of UNIX accessing my blog (probably a crawler). Five types of browsers were used to access my blog: Firefox (61%), Internet Explorer (36%), Safari (1%), Chrome (1%) and Opera (1%). For the week (October 29, 2010 to November 5, 2010), there were 119 visits from six countries: USA, France, Poland, Russia, China and South Korea. Again, the majority of hits came from the U.S. (90%). With the exception of one user, everyone used MS Windows OS to access my blog. The lone user was using Apple's Macintosh OS. Four types of browsers were used to access my blog: Firefox (75%), Internet Explorer (22%), Opera (1%) and Safari (1%).
 Here are the most accessed posts for the week (October 29, 2010 to November 5, 2010). Not surprisingly, Kick Starting Your Analytics Strategy was the most popular post with 17 hits. That's probably one of my better posts, and the topic that prompted me to start writing this blog.
 I will finish with this useless trivia - the total surface area for the countries mentioned in this post is approximately 20 million square miles, which comprises 35 percent of the earth's land mass.
Few things in life are as fun as putting together a mortgage application on a Saturday morning. But there I was, working furiously to complete my application, lest the rates jump up before I could send my package to the broker (Yep, I get spooked very easily). One requirement was to provide two months of bank statements. Being the tech savvy person, I locked myself out of the Citibank website (be cautious when typing your password or other information. Three wrong attempts, and your day is pretty much ruined). After the customary call to the help center where a heavily accented guy named ‘Jay’ (Don’t snicker, guys. It could be short for Jaysuria) informed me that I needed a new PIN and my best hope was to go to a local Citibank branch. He could request a new PIN, but that would take five business days (and leave me completely hosed).  I rushed to my local Citibank branch with two forms of identification, and approached the customer rep. It turned out that my PIN was still valid, but the website had locked me out. The customer rep, a really nice elderly guy, told me I could use his computer to unlock my account and get a new password. He also called the help center for me. So I ended up sitting on his chair, talking on his phone, working on his computer, behind the customer rep desk. As I was speaking on the phone and trying to reset my password on the computer, a person approached the customer rep desk. The Citibank customer rep took him aside to discuss his problem. As luck would have it, a snobbish couple entered the bank a few minutes later, and walked straight towards me. There I was – unshaven, wearing jeans, a wrinkled T-shirt with the words ‘INTO GETTING DIRTY?’, talking on the phone, completely ignoring them. As I made eye contact, I could tell both of them were pretty pi$$ed. The woman shot me an angry look, like she was going to burn me to ashes right there. The stare lasted only for a few seconds, the customer rep came running and took them away.
  I am guessing the couple and I walked out of the bank with completely opposite views on service. For a few minutes, I felt like an actual Citibank employee. Oh well, something to talk about at the office on Monday morning.
Over the years, I have worked for quite a few organizations. In any organization, tracking incidents and functional changes in a system is a very challenging task. Unfortunately, most places don't do a good job in tracking these changes. Nevertheless, I found this Excel template to be a very cheap and effective tool for tracking incidents and functional changes in a system.
The tracking document has three main sections. The summary page, the open incidents page(s), and the closed incidents page. If needed, another section can be added for action items. These sections are discussed in detail below:
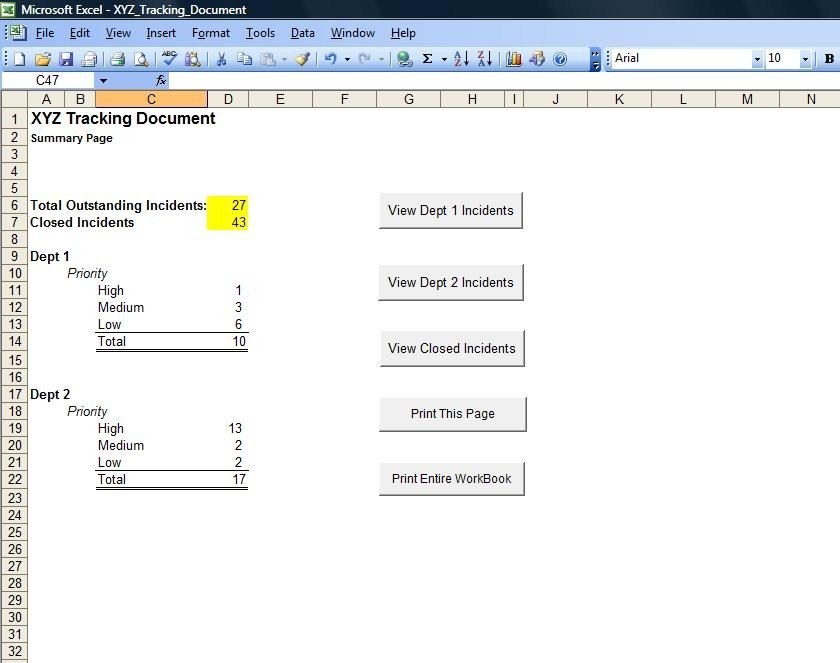
The Summary Page
The Summary Page has a simple layout that show the number of incidents that are open, and the number of incidents that have been closed. There are additional drill down sections that shows the open incidents for each department (i.e., dept 1, dept 2, etc.). The open incidents for each department is categorized by priority (i.e., High, Medium, Low). The priority count is calculated by a macro that inputs the value directly from the 'severity level' column from a particular department's open incidents page. the closed counts are directly input from the closed incidents page, using an Excel VBA macro.
The page also contains several buttons for ease of use. In the example below, the first two buttons opens the 'Open Incidents' page for their respective departments. The third button opens the 'Closed Incidents' page. The fourth button prints summary page. The fifth button prints out the the entire tracking work book in a predetermined print layout.  Here is the Excel VBA macro code for calculating incidents in the summary page.
 Here is the Excel VBA macro code for the buttons.
 Assigning the Excel VBA macro code to the buttons.
The Open Incidents Page
The Open incidents page contain the functional changes that are yet to be completed. Ideally, there should be one Open Incidents page per department.
 The incidents are color coded to depict whether the changes are being made on time, or the deadlines are slipping. The color of the row is assigned by a VBA macro that calculates the difference between the expected date (i.e., ETA) and the current date. If the difference between the ETA and current date is seven days or less, the incident row is given a yellow color. If the ETA has been missed,i.e., the current date has passed the ETA, the incident row is given a red color. Looking at the page, an analyst can immediately ascertain which incidents need to be resolved within a week, as well as which incidents have missed their deadlines.
Here is the Excel VBA macro code to color code the incident entries: The Open Incidents page has the following columns (The list below is just a suggestion. You can add/delete as many columns as you want):
Rank: Out of all the incidents, which incident should be tackled foremost. Also, provides a way to sort all the incidents as management may wish.
Priority: Based on three categories - High, medium and low - which group of incidents should be worked on first.
Ticket Number: Every incident should be tagged with a ticket number for tracking and audit purposes.
Date Opened: When the incident was first reported.
Description: A brief description of the incident. Try to make it as descriptive as possible.
Business Owner: The unit that owns the incident or is the most impacted by it.
Assigned to: The person(s) who will be responsible for making the functional change.
ETA: The expected date when the functional change will be made.
Updates: This is probably the most important and useful section. Put a concise status of the open incident preceded by a date.
Impact: What system(s) are impacted by the functional change.
Severity level: How severe the open incident is (i.e., high, medium, low). It is important to fill out this field, because the summary table calculates the incidents by category from this field.
Status: Whether the status of the incident is open or closed. If the incident is listed in this page, the status should always be 'Open'.
Resolution: How the incident was resolved. If the incident is listed in this page, this field should remain blank.
The Closed Incidents Page
Finally, when an incident has been resolved or a functional change made, move the entire row from the Open Incidents page and transfer it to the Closed Incidents page. Fill out the resolution field. It is also important to change the status field from 'open' to 'closed', because the summary page calculates the number of closed incidents from this value. You can also create a page for action items, which are system improvements that come up during discussion. These changes do not need to be worked on right away, but can be implemented during a future release.
The U.S. Census Bureau provides seasonal adjustment factors for 20 different industries. Using SAS, you can directly read in those adjustment factors into your program from the census bureau website. Here is the code:filename adjf url 'http://www.census.gov/retail/marts/www/download/text/adv44000.txt';
data seasonal_adjustment_factors;
infile adjf firstobs=26;
input year jan feb mar apr may jun jul aug sep oct nov dec;
if year = . then delete;
run;The output is shown below (in Excel):
 In the example above, I'm reading in the seasonal adjustment factors for retail (total). Pick the code for your industry from the list below, and substitute it with the red text in the URL:Kind Of BusinessRetail and Food Services, total - adv44x72 Total (excl. Motor Vehicle) - adv44y72 Retail, total - adv44000 Retail (excl. Motor Vehicle and Parts Dealers) - adv4400a Motor Vehicle and Parts Dealers - adv44100 Auto, other Motor Vehicle - adv441x0 Furniture and Home Furnishings Stores - adv44200 Electronics and Appliance Stores - adv44300 Building Material and Garden Equipment and Supplies Dealers - adv44400 Food and Beverage Stores - adv44500 Grocery Stores - adv44510 Health and Personal Care Stores - adv44600 Gasoline Stations - adv44700 Clothing and Clothing Accessories Stores - adv44800 Sporting Goods, Hobby, Book, and Music Stores - adv45100 General Merchandise Stores - adv45200 Dept. Stores (ex. leased depts) - adv45210 Miscellaneous Store Retailers - adv45300 Nonstore Retailers - adv45400 Food Services and Drinking Places - adv72200So stick this code into your time series model, and you should be good to go. Happy programming!
 For the week (October 29, 2010 to November 5, 2010), there were 119 visits from six countries: USA, France, Poland, Russia, China and South Korea. Again, the majority of hits came from the U.S. (90%). With the exception of one user, everyone used MS Windows OS to access my blog. The lone user was using Apple's Macintosh OS. Four types of browsers were used to access my blog: Firefox (75%), Internet Explorer (22%), Opera (1%) and Safari (1%).
 Here are the most accessed posts for the week (October 29, 2010 to November 5, 2010). Not surprisingly, Kick Starting Your Analytics Strategy was the most popular post with 17 hits. That's probably one of my better posts, and the topic that prompted me to start writing this blog.
 I will finish with this useless trivia - the total surface area for the countries mentioned in this post is approximately 20 million square miles, which comprises 35 percent of the earth's land mass.